The Investor Intelligence Conference portion of MJBizCon’s Passholder Days offered insights on cannabis investing and what the post-election investment climate looks like. If you missed it or want to watch it again, it’s still available to you on demand. The price increases $50 after Nov. 19.
While marijuana legalization was a major winner in the U.S. general election, Canadian firms appear to be reveling in the post-election boost more than American cannabis companies.
After the Nov. 3 vote, Alberta, Canada-based Aurora Cannabis stock prices increased as much as 195% in three days and traded seven times the dollar volume of the public U.S. operators combined.
And that’s despite the fact Aurora has no U.S. operations and the company filed a prospectus in late October for a shelf offering of stock worth up to $500 million.
Why is that?
Specifically, Canadian cannabis companies benefit from:
- The liquidity offered by Canada’s federal legalization.
- Their ability to trade on the New York Stock Exchange (NYSE) or the Nasdaq instead of merely the over-the-counter markets or Canadian exchanges.
Most importantly for the sector, the rapid jump in dollar volume on the NYSE and Nasdaq illustrates the Canadian companies’ ability to access capital at a lower cost.
That’s something American plant-touching operators can look forward to only as U.S. legalization efforts advance.
Canadian operators rise more despite greater benefit to US operators
In the days after the election, most cannabis stocks rose – likely influenced by the passage of legalization measures in five states.
But, as noted, Canadian operators rose much more than U.S. operators.
Looking only at companies whose stocks had at least $100,000 of average daily U.S. dollar volume (shares traded each day times stock price in U.S. dollars) in the year before the election, Canadian operators’ stock prices have increased an average of 20% while the non-plant-touching ancillary companies serving the industry rose 11%. By comparison, U.S. operators increased 9%.
Part of this might be that Canadian operators had already declined 49% year-to-date while U.S. companies posted average gains of 23%. Those moves, to be sure, were justified on the fundamentals to date.
The addition of five U.S. states legalizing cannabis does not directly benefit Canadian operators.
At best, incremental U.S. legalization offers a new market to enter, but this is a competitive situation with different regulations for each market and already-established, well-run competitors vying for a piece of the pie.
In the first four trading days of the election (Nov. 4-9), Canadian operators had closed up an average of 37%, with Aurora climbing an astonishing 128% and British Columbia-based Tilray up 53%.
Meanwhile, U.S. operators increased only 15% despite the fact they fundamentally and directly benefit the most from U.S. legalization – for example, near-term access to a larger American market and long-term benefits of potential increased legalization, such as lower cost of capital with access to normal banking, capital markets, U.S. exchanges and typical corporate tax rates.
On the heels of some earnings reports and an equity offering by Aurora, the Canadian stocks declined by 9% between Nov. 9 and Nov. 13, while the U.S. operators declined by 4%.
Ancillary stocks generally did well as both California-based Innovative Industrial Properties and Colorado-headquartered GrowGeneration beat expectations for the quarter.
Click here to download the expanded data set for the table below, including company breakouts.
| Table 1: Post-US Election Stock Price Moves | ||||
| % Return Since Election Nov. 3-13 |
% Return Nov. 3-9 |
% Return Nov. 9-13 |
% Return YTD-Nov. 3 |
|
| Canadian Operators | 19.8 | 37.1 | -8.8 | -48.5 |
| Ancillary | 10.8 | 16.7 | -3.6 | 5.8 |
| US Operators | 9.0 | 15.1 | -3.8 | 22.7 |
| Overall | 12.9 | 22.5 | -5.4 | -4.8 |
| Source: Sentieo and MJResearchCo | ||||
NYSE and Nasdaq offer huge access to liquidity
More astonishing than the percentage increase in Aurora’s stock price (and those of other Canadian operators) is the volume that drove it.
The chart below shows the daily average U.S. dollar volume after the election compared with the daily average in the year leading up to the election.
Aurora’s average daily volume increased twelvefold from $76 million per day to $901 million. Tilray’s quadrupled to $292 million from $67 million.
Collectively, the Canadian daily average U.S. dollar volume quintupled to $1.8 billion from $373 million in the week after the election.
In comparison, 14 U.S. operators’ daily dollar volume tripled to $128 million, but this still remains less than Ontario-headquartered Canopy Growth’s average daily dollar volume for the past year.
In total, the Canadian operators trade 9-14 times as much as the U.S. operators, led by Aurora.
Click here to download the expanded data set for the table below, including company breakouts.
| Table 2: Trading Volume by Market | |||
| Listed in thousands (000) US dollars | Avg. Daily USD Volume Nov. 3-Nov. 13, 2020 |
Avg. Daily USD Volume Nov. 3, 2019-Nov. 3, 2020 |
Change in Avg. Daily USD Volume |
| Canadian Operators | $1,784,749 | $372,631 | $1,412,118 |
| Ancillary | $352,311 | $130,708 | $221,603 |
| US Operators | $128,316 | $40,434 | $87,882 |
| Grand Total | $2,265,377 | $543,773 | $1,721,604 |
| Source: Sentieo and MJResearchCo | |||
Because they operate in a federally illegal business, U.S. plant-touching operators generally cannot trade on the NYSE or Nasdaq. Instead, they must trade on the Canadian exchanges and OTC markets.
Meanwhile, federally legal Canadian operators and ancillary businesses are permitted to trade on the NYSE and Nasdaq – which creates the bizarre situation where American companies generally trade on the Canadian Securities Exchange and their northern counterparts can generally be found on U.S. exchanges.
But this also means that the Canadian operators enjoy much higher liquidity and a lower cost of capital, given the greater access to both institutional and retail investors.
The table below, presenting the same data as Table 2 but by exchange, shows that the returns were highest on the NYSE (+23%) and Nasdaq (+22%) and the daily dollar volume increased by $1.5 billion, representing 85% of the incremental dollar volume flowing into cannabis post-election.
We can also see that no U.S. plant-touching operators trade there. The exchanges where U.S. operators do trade (the Canadian Securities Exchange as well as the OTC and NEO exchanges) experienced an increase of only $88 million in daily dollar volume.
Indeed, the lower-liquidity Toronto Stock Exchange saw an average increase of only 13%, but that figure is just 8% if we exclude the Canadian operators that also trade on the NYSE and Nasdaq.
More importantly, this shows the potential to increase liquidity and access to capital that could become available to American plant-touching operators when the issues of federal illegality in the U.S. get resolved.
| Table 3: Trading Volume by Exchange | |||||||
| Millions of US dollars | Avg. % Return Since Election Nov. 3-13 |
Avg. Daily USD Volume Nov. 3-Nov. 13, 2020 |
Avg. Daily USD Volume Nov. 3, 2019-Nov. 3, 2020 |
Change in Avg. Daily USD Volume | No. of Canadian Operator Stocks | No. of US Operator Stocks | No. of Ancillary Stocks |
| New York Stock Exchange | 23.2 | $1,120 | $243 | $877 | 2 | 0 | 2 |
| Nasdaq | 22.3 | $740 | $161 | $579 | 4 | 0 | 3 |
| Toronto Stock Exchange | 12.9 | $273 | $97 | $176 | 8 | 0 | 3 |
| Canadian Securities Exchange (CSE/CNSX) | 7.8 | $62 | $18 | $44 | 0 | 17 | 0 |
| OTC Markets | 9.6 | $65 | $23 | $42 | 3 | 18 | 4 |
| Aequitas NEO-L | 1.6 | $2 | $0 | $2 | 0 | 2 | 0 |
| TSX Venture Exchange | 18.1 | $2 | $1 | $1 | 3 | 0 | 1 |
| Grand Total | 12.1 | $2,264 | $543 | $1,721 | 20 | 37 | 13 |
| Source: Sentieo and MJResearchCo | |||||||
Green-wave euphoria a preview of US normalization
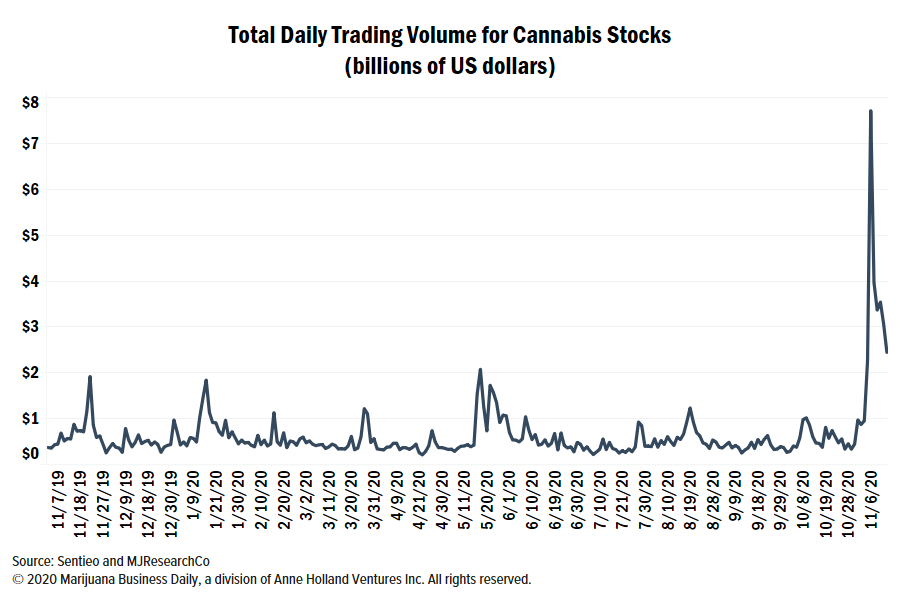
Capital seems to have rapidly rushed into the securities where the liquidity existed after the election.
The total dollar volume of all the cannabis companies spiked to $7.7 billion on Nov. 6 (more than three times the previous year’s highs) and remained elevated at about twice the previous year’s average ($1.2 billion on Nov. 13 versus $553 million on average for the previous year).
After reporting mixed results on Nov. 9, Aurora smartly announced an equity offering of $125 million (later increased to $150 million and ultimately closed at $172.5 million) at $7.50 for a share and a warrant to purchase half a share at $9.00.
This offering was unsurprising since Aurora had already filed a prospectus on Oct. 27 to raise $500 million over the next two years in an at-the-market offering. The company took advantage of the rapid rise in the stock price and liquidity to sell 30% of the planned offering at once.
Despite being in the midst of a turnaround after a troubled year, Aurora still rapidly raised $172.5 million on the NYSE at a roughly 50% premium to the previous week.
Raising equity at a 50% higher price (for 50% less dilution) is a big positive for long-term shareholders (and painful for anyone who bought on Nov. 6 and Nov. 9 between $8.12-$14.48 per share).
At the MJBizCon Investor Intelligence Passholder Day, many speakers said they expected either the SAFE Banking Act or STATES Act to pass within the next two years.
Though nothing is certain in politics, such legislation could normalize access to capital for U.S. plant-touching operators.
Imagine if these companies, with stronger fundamentals, historically better execution, more attractive end markets and lower valuations than their Canadian counterparts, had access to that kind of liquidity?
Mike Regan is the founder of MJResearchCo and a regular contributor to Marijuana Business Daily. He can be reached at mjresearchco.com or directly at info@mjresearchco.com.