
Due diligence helps an investor frame an investment opportunity and, more importantly, to gauge the risks. Experienced investors understand this, but it can be easy to overlook critical elements of the process.
Take the first step, which can be a broad, overarching question such as “What do they sell?”
Most companies sell multiple products or services – and often they sell both. It’s important to understand every product and service that generates revenue and, ultimately, cash flow and earnings.
We need to know:

- What is the percentage of total revenue for each product?
- What is the growth rate of each product?
- What is the price of each product the company sells?
- What is the addressable market size for each product?
All those factors can have a huge impact on the attractiveness and risk of the investment opportunity.
Let’s look at some examples.
Product Mix and Growth Rates
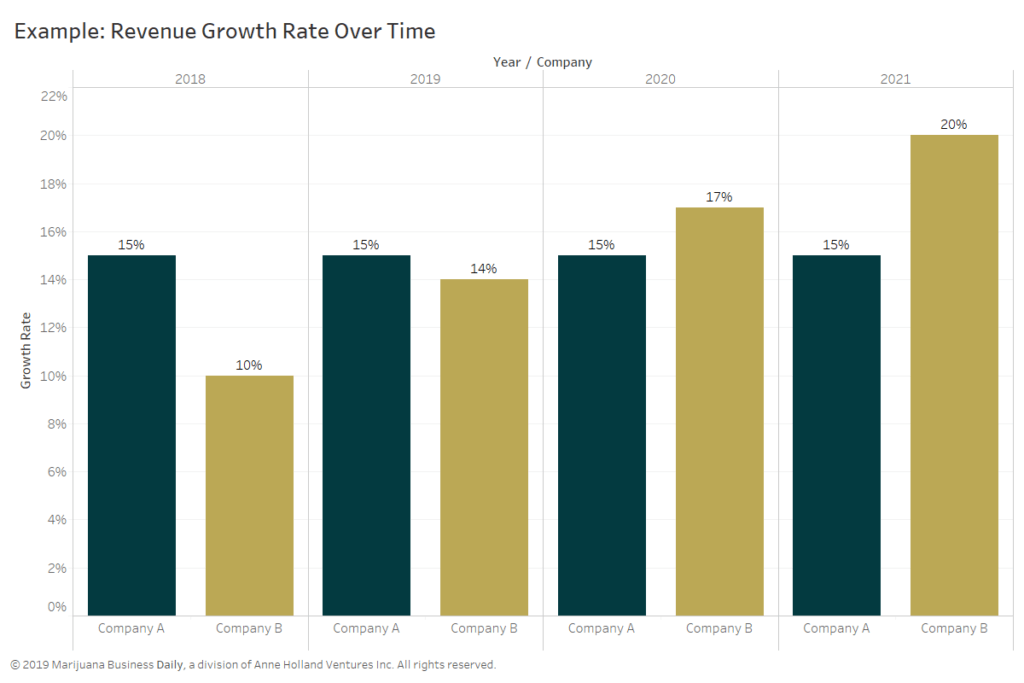
Company A is growing revenue at 15%, while Company B is growing revenue at 10%. At first glance, Company A looks like the better revenue-growth situation.
However, the details of revenue mix and growth rates matter for investment purposes.
Say Company A sells one product, infused gummies, which grows at 15% and is estimated to continue to grow at that rate for the next several years.
Company B sells two products, CBD oils and tinctures:
- Product No. 1, CBD oil, accounts for 80% of revenue and is forecast to grow at 5%.
- Product No. 2, CBD tinctures, makes up 20% of revenue and is forecast to grow at 50%.
Even with the high-growth tincture product, Company B’s current overall revenue growth is just 10%, less than Company A’s growth of 15%.
However, investing is about assessing future performance, so we need to understand what current performance and recent trends can indicate about the future.
Even though Company B’s tinctures are less than 20% of the revenue mix, because of the high-growth rate, the product is projected to be more than 40% of the firm’s revenue mix in three years. That product category can push Company B’s overall growth to 20%.
Product mix and growth rates matter!
Product Price and Total Addressable Market Size
The simplest way to think about product revenue is price X units sold. Thorough due diligence should include exploration of product price trends.
Using a hypothetical example again, if tincture prices have started to decline 10% annually while pricing in other product categories have been stable, that could call into question the ability of Company B to keep growing tincture revenues at 50% for the next few years.
Total addressable market (TAM) size is a crucial due diligence step when framing investment opportunity and risk.
Continuing with our hypothetical examples, Company A sells gummies that have a TAM of $10 billion estimated to grow 10% annually, reaching $13 billion in four years.
We see that Company A currently has a 5% share of the gummy market. With the estimated company and TAM growth rates, the firm is projected to have a 6% market share for gummies.
| Company A – GUMMIES | 2018 | 2019 est | 2020 est | 2021 est |
| Revenue in Dollars | 500 | 575 | 661 | 760 |
| Gummies TAM | 10,000 | 11,000 | 12,100 | 13,310 |
| TAM Growth Rate | 10% | 10% | 10% | 10% |
| Gummies Market Share | 5% | 5% | 5% | 6% |
Company B’s oil products currently have a 5% market share of an $8 billion TAM estimated to grow at 5%. With the estimated company and TAM growth rates, the firm’s oil market share is expected to remain stable at 5%.
| Company B – OILS | 2018 | 2019 est | 2020 est | 2021 est |
| Revenue in Dollars | 400 | 420 | 441 | 463 |
| Oils TAM | 8,000 | 8,400 | 8,820 | 9,261 |
| TAM Growth Rate | 5% | 5% | 5% | 5% |
| Oils Market Share | 5% | 5% | 5% | 5% |
Company B’s tinctures have a 13% share of a relatively small $750 million TAM projected to grow at 15%. The estimated company and TAM growth rates imply their market share would go from 13% in 2018 to 30% by 2021.
| Company B – TINCTURES | 2018 | 2019 est | 2020 est | 2021 est |
| Revenue Growth Rate | 100 | 150 | 225 | 338 |
| Tinctures TAM | 750 | 863 | 992 | 1,141 |
| TAM Growth Rate | 15% | 15% | 15% | 15% |
| Tinctures Market Share | 13% | 17% | 23% | 30% |
Given industry competitive dynamics, does that seem a plausible or risky forecast?
The goal of thorough due diligence is to ask questions aimed to provide answers that allow you to better understand opportunity and risk.
Our Investor Intelligence research will delve deep into market and company fundamentals to provide you with valuable insight to help you frame the opportunities and risks of your cannabis investments.