While U.S. cannabis markets might appear similar on the surface, each is driven by different consumer spending habits – and it is critical for marijuana manufacturers and retailers to understand these patterns as they develop and sell products for each state.
Basket size has long been a metric that has helped them do that.
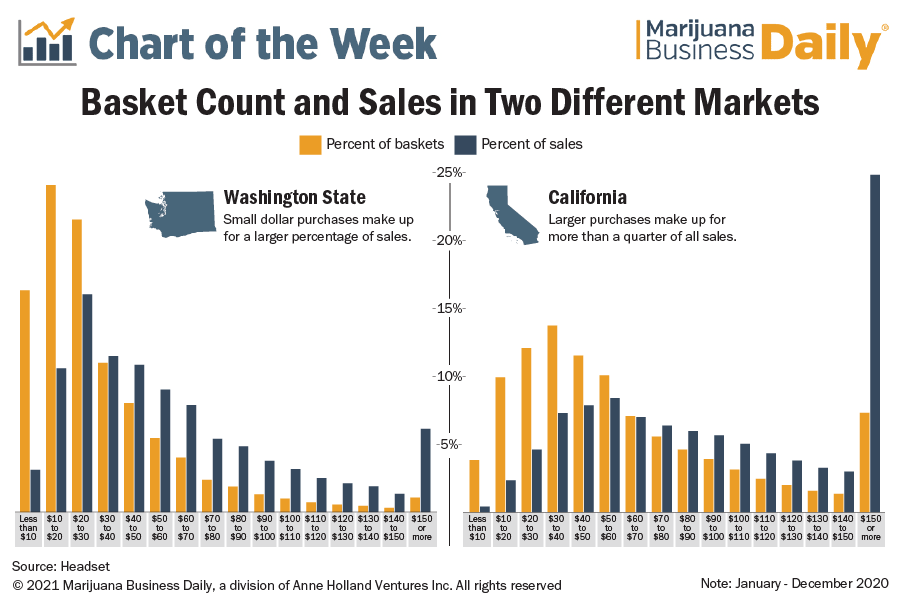
For example, retail basket size data provided by Seattle-based data analytics firm Headset showed that a quarter of all purchases in California in 2020 were from consumers spending more than $150 at one time, while purchases of less than $40 made up a larger percentage of sales in Washington state.

Retailers are often encouraged to increase average basket size by reducing out-of-stock merchandise, changing product placement, offering loyalty programs or providing discounts.
But focusing on basket size alone can mislead marijuana retailers.
They should also consider the comparative profitability of the baskets within the individual markets.
For example, a consumer who spends $50 in California isn’t contributing as much to revenue as one in Washington, because that particular basket size in California is significantly lower than the average.
And the data will always be changing.
California consumers spent more per visit in 2020 versus 2019, with big spenders also increasing as a percentage of revenue.
The number of high-value baskets (worth more than $150) in California increased 44% in 2020, accounting for 25% of total revenue received.
Andrew Long can be reached at andrew.long@mjbizdaily.com